import numpy as np
import cv2
import matplotlib.pyplot as plt
image=cv2.imread('../input/hillstation/hillstation.jpg')
plt.imshow(image) #original image
<matplotlib.image.AxesImage at 0x7f8efaabf890>
i=image.sum(axis=2) #convert the shape of image in 2 dimensions
i.shape
(183, 275)
img=cv2.cvtColor(image,cv2.COLOR_BGR2RGB)
plt.imshow(img) #convert the image into RGB
<matplotlib.image.AxesImage at 0x7f8efa9e9550>
vector=img.reshape((-1,3)) #convert the mXNX3 image into kX3 matrix where k=mXn and each row will be a vector in 3 dimensions space
vector
array([[ 55, 61, 111],
[ 55, 61, 111],
[ 55, 61, 113],
...,
[ 42, 40, 25],
[ 35, 33, 18],
[ 28, 26, 13]], dtype=uint8)
vector=np.float32(vector) #convert the uint8 values to float values. k-means method to opencv
vector
array([[ 55., 61., 111.],
[ 55., 61., 111.],
[ 55., 61., 113.],
...,
[ 42., 40., 25.],
[ 35., 33., 18.],
[ 28., 26., 13.]], dtype=float32)
#clustering into multiple labels as the picture has multiple colours.
c=(cv2.TERM_CRITERIA_EPS + cv2.TERM_CRITERIA_MAX_ITER, 10,1.0)
# first parameter is used for stop the criteria if the accuracy is achieved
# second parameter is used for stop the algorithm after he specified number of iterations
# 'c' is the iteration termination process. When the iteration is satisfied, the algorithm will stop.
k=5 #number of clusters
attempts=10 #number of times the algorithm is executed using different labelings.
ret,label,center=cv2.kmeans(vector,k,None,c,attempts, cv2.KMEANS_PP_CENTERS)
#cv2.kmeans_pp_centers is used to specify how initial centers are taken
center=np.uint8(center)
res=center[label.flatten()] #access the label to regenerate the image
im=res.reshape(img.shape)
#visualization
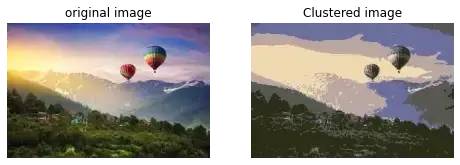
x=8
y=6
plt.figure(figsize=(x,y))
plt.subplot(1,2,1)
plt.imshow(img)
plt.title('original image')
plt.axis(False)
plt.subplot(1,2,2)
plt.imshow(im)
plt.title('Clustered image')
plt.axis(False)
(-0.5, 274.5, 182.5, -0.5)

原始图像与聚类图像
